
In today’s digital landscape, understanding content performance is paramount to success. Whether you’re a seasoned marketer, a burgeoning content creator, or a business owner, measuring and analyzing your content’s impact is no longer optional—it’s essential. This comprehensive guide delves into the critical aspects of content measurement and content analysis, providing you with actionable insights to optimize your strategy and achieve your objectives. We will explore key performance indicators (KPIs), effective analytical tools, and proven techniques to unlock the secrets of truly effective content. By understanding how to measure and interpret your content performance data, you can refine your approach, maximize your reach, and ultimately drive meaningful results.
This guide, “Unlocking the Secrets of Content Performance: A Guide to Effective Measurement and Analysis,” will equip you with the knowledge and skills necessary to navigate the complexities of content performance analysis. From defining your content goals and identifying relevant KPIs to utilizing advanced analytics platforms and interpreting data-driven insights, we will cover every step of the process. By mastering the art of content measurement and analysis, you can transform your content from a simple output into a powerful engine for growth and engagement. Prepare to unlock the true potential of your content and achieve unprecedented success in the digital realm.
Defining Your Key Performance Indicators (KPIs)
Defining the right Key Performance Indicators (KPIs) is the crucial first step in measuring content effectiveness. KPIs are quantifiable metrics that reflect your content’s success in achieving specific business objectives. Choosing the right KPIs provides a clear roadmap for content creation and allows you to track progress and demonstrate ROI.
Start by clearly defining your content goals. Are you aiming to increase brand awareness, generate leads, drive sales, or improve customer retention? Different goals necessitate different KPIs.
For brand awareness, consider metrics like reach, impressions, and social shares. If lead generation is your focus, track form submissions, email sign-ups, and content downloads. For sales-driven content, monitor metrics like conversion rates, revenue generated, and average order value.
Don’t track every metric available. Focus on the KPIs that are most relevant to your specific business objectives. This focused approach will provide clearer insights and enable more effective data analysis.
Setting Up Tracking Mechanisms and Analytics Tools
Accurate content performance measurement relies on robust tracking mechanisms and analytics tools. Implementing these tools correctly is crucial for gathering reliable data.
Start by integrating a web analytics platform like Google Analytics. This foundational tool provides insights into website traffic, user behavior, and conversions. Configure goals and events to track specific actions users take on your website, such as form submissions or downloads. This allows you to connect content consumption directly to desired outcomes.
Beyond website analytics, consider leveraging social media analytics platforms native to each platform. These dashboards offer data on engagement, reach, and audience demographics. Consistent tracking across platforms provides a holistic view of your content’s performance.
Finally, explore more advanced tools for specific needs. Heatmapping software visualizes user interaction on web pages, revealing how users engage with your content. A/B testing platforms facilitate controlled experiments to optimize content variations for maximum impact.
Analyzing Website Traffic and User Behavior
Analyzing website traffic and user behavior is crucial for understanding how your content performs and how users interact with it. Website analytics provide valuable data that can inform content strategy and optimization efforts.
Key metrics to track include page views, which indicate the number of times a page has been viewed. Unique visitors provide insight into the number of individual users visiting your website. Bounce rate reveals the percentage of visitors who leave a page after viewing only one page, signaling potential issues with content relevance or user experience.
Time on page and average session duration indicate user engagement with your content. Longer durations suggest higher interest and value. Analyzing traffic sources (e.g., organic search, social media, referrals) reveals which channels are most effective in driving traffic to your website.
Understanding user navigation patterns, including the pages they visit before and after consuming your content, helps optimize website structure and internal linking strategies. Heatmaps visually represent user interaction with specific page elements, identifying areas of interest and potential usability issues.
Measuring Social Media Engagement and Reach
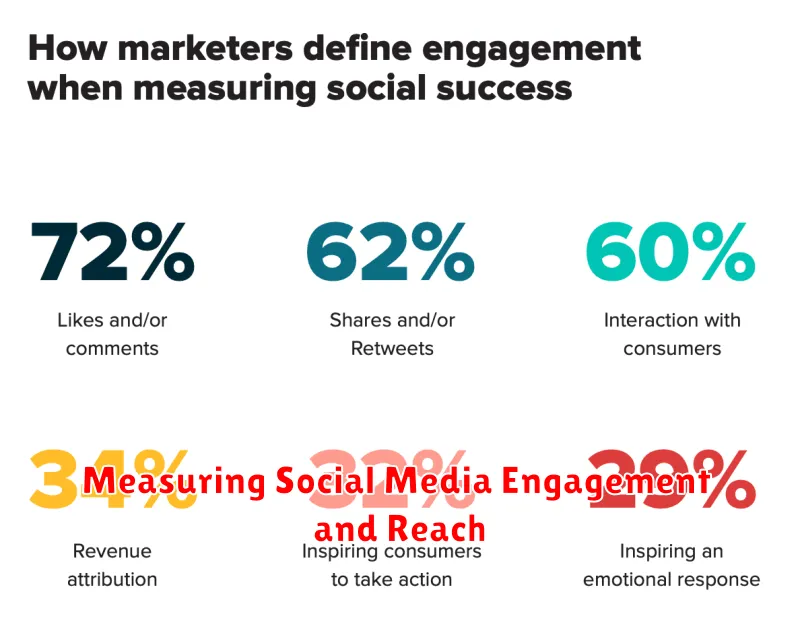
Social media measurement is crucial for understanding content effectiveness. Tracking engagement reveals how your audience interacts with your content. This includes metrics like likes, comments, shares, and saves. Reach indicates how many unique users see your content. Monitoring these metrics helps gauge content visibility and audience interest.
Each platform offers native analytics dashboards providing valuable data. Likes reflect basic approval, while comments reveal deeper engagement and sentiment. Shares demonstrate how compelling your content is for amplification within networks. Saves suggest users find value in your content for future reference. Analyzing these interactions offers insights into which content resonates most with your audience.
Reach metrics help determine your content’s visibility. A higher reach suggests broader exposure. Consider segmenting reach by demographics or interests to understand audience composition. Regularly monitoring these metrics helps identify trending topics and tailor future content for optimal engagement and wider distribution.
Understanding the Impact of Content on Conversions
Content plays a crucial role in driving conversions. Analyzing how your content influences user actions is key to optimizing your content strategy for better results. Whether your goal is to generate leads, increase sales, or encourage sign-ups, understanding the connection between content and conversions is paramount.
Begin by identifying the specific conversion actions you want to track. This could include form submissions, product purchases, or clicking a specific call-to-action button. Then, correlate these conversions with the content users interacted with before converting. Which blog posts, landing pages, or product descriptions led to the highest conversion rates?
Attribution modeling helps determine which content pieces contributed most significantly to a conversion. Was it a blog post that initially attracted the user, or a product demo video that sealed the deal? Understanding these touchpoints allows you to refine your content strategy and invest in content formats that demonstrably drive conversions.
Using A/B Testing to Optimize Content Performance
A/B testing, also known as split testing, is a crucial method for optimizing content performance. It involves comparing two versions of a piece of content (A and B) to determine which performs better based on a specific metric.
The process begins by identifying a variable to test, such as a headline, call to action, or image. Version A represents the original content, while Version B includes the modified element. Both versions are then presented to separate, randomly assigned groups of users.
Tracking the performance of each version allows you to gather data on the chosen metric, such as click-through rate, conversion rate, or time spent on page. Statistical analysis then reveals whether the changes in version B resulted in a significant improvement over version A.
A/B testing provides data-driven insights, enabling you to make informed decisions about content optimization. By iteratively testing and refining your content, you can maximize its impact and achieve your desired goals.
Monitoring Your Brand Reputation and Sentiment
Brand reputation and sentiment analysis are crucial for understanding public perception of your brand and its content. Tracking these metrics allows you to identify potential PR crises, understand customer satisfaction, and adjust your content strategy accordingly.
Utilizing social listening tools helps monitor brand mentions and conversations across various online platforms. These tools track keywords related to your brand and categorize mentions based on sentiment (positive, negative, or neutral).
Pay close attention to negative sentiment. Investigating the source and reasoning behind negative mentions allows you to address concerns and mitigate potential damage to your brand image. Conversely, analyzing positive sentiment highlights successful content strategies and areas for further development.
Sentiment analysis can also provide valuable insights into audience reactions to specific content pieces. This information helps optimize future content to better resonate with your target audience. Tracking sentiment over time allows you to observe the impact of your content strategy on overall brand perception.
Generating Reports and Visualizing Your Data

Data analysis culminates in the creation of comprehensive reports and visualizations that communicate key findings effectively. Clear reporting is essential for demonstrating the impact of your content strategy and informing future decisions.
Choose reporting formats that suit your audience and objectives. Formal reports might include detailed tables and statistical analysis, while dashboards provide a quick overview of key metrics. Visualizations like charts and graphs can make complex data more accessible and engaging.
Key elements of a comprehensive report include:
- Executive summary highlighting key findings.
- Detailed data breakdowns for deeper analysis.
- Visual representations of trends and patterns.
- Actionable insights and recommendations for improvement.
Data visualization tools offer a variety of options for presenting your data, from simple bar graphs to interactive dashboards. Select visualizations that clearly communicate your message and highlight key trends. Consider using tools that allow for data exploration and customization.
Adapting Your Content Strategy Based on Data Insights
Data analysis isn’t a passive exercise; it’s a driver for continuous improvement. The insights gathered from your content performance measurement should directly inform and refine your content strategy.
Identify areas where your content excels. What resonates most with your audience? Double down on these high-performing themes and formats. Conversely, understand where your content falls short. Is there a disconnect between what you’re producing and what your audience wants? Are certain distribution channels underperforming? Use this data to adjust your approach, whether it involves tweaking content topics, experimenting with different formats, or refining your distribution strategy.
Flexibility is key. The digital landscape is ever-evolving. Be prepared to pivot your content strategy based on emerging trends and audience feedback. Regularly review your analytics, conduct A/B testing, and stay attuned to industry best practices to ensure your content strategy remains effective and relevant.